


Banks are the mother of all industries, and the failure of a bank can potentially trigger a domino effect, causing other banks to become overly conservative and unwilling to lend, ultimately impacting the overall economy. Examples include the 2008 global financial crisis and the collapse of the Bank of US in 1929. Both sparked global economic depressions.
Given the crucial role of banks in the financial industry, it is important for investors to understand the true reasons behind bank failures.
In early March, the collapse of Silicon Valley Bank (SVB) hit the market. The management of SVB cited the Federal Reserve’s tightening monetary policy and the reduction of liquidity as reasons for its fall. Many start-up companies that are still incurring losses have relied on large venture capital inflows. As the liquidity condition tightened, they are forced to use their bank deposits to maintain the business operations. As a result, SVB’s customers, primarily consisting of start-up companies, have been making withdrawals, leading SVB to sell some of its bond investments to raise funds. However, over the past year, the Federal Reserve has raised interest rates significantly, causing bond prices to plummet, and SVB’s sale of some of its bonds has subsequently impacted its capital adequacy ratio. The company originally planned to raise funds through the stock market, but the market viewed it as a precursor to potential problems at SVB, which further accelerated the outflow of deposits. The banking business is fundamentally built on trust. When trust is lost, crowded customer withdrawals can lead to liquidity crunch, which will put even the strongest banks to the brink of failure.
The above explanation is from the management of the company, but upon closer examination of the annual reports of US major banks, it becomes clear that while some of the explanations are true, others are somewhat misleading.
SVB claims that its problem stems from the decline in deposits. But in fact, this is not unique to SVB, as major banks in the US such as Wells Fargo and Bank of America have also experienced declines in deposits. The reason is not hard to understand – the broad money supply M2 in the US has declined by 1.7% as of January over the past year, indicating that both cash and bank deposits are contracting. SVB’s deposits declined by 8.5% last year, which is 2% more than Wells Fargo’s 6.6% decline and Bank of America’s 6.5% decline, but this is not a significant difference. The question is why SVB is the one facing bank runs. Is it because SVB encountered problems in managing its balance sheet? To answer this question, we have to look deeper into its asset allocation. The asset allocation of each bank is different. For example, commercial banks like Wells Fargo allocate approximately 45% of their assets to loans, 27% to bonds (including long-term holdings and short-term trading), 12% to cash, and the remaining portion may consist of financial derivatives, goodwill, fixed assets, or other assets, etc. As for commercial and investment bank hybrid, such as Bank of America, loans account for 31% of their assets, bond investments account for 31%, cash accounts for 11%, and the remaining 27% is allocated to trading accounts, repurchase operations with central banks, fixed assets, and other businesses, etc.
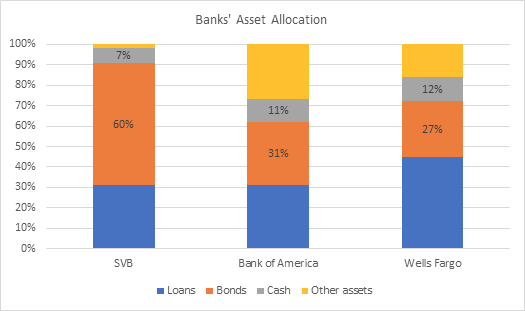
SVB’s asset allocation differs from the previous two examples in two ways. First, its bond investments account for approximately 60% of its total assets, which is much higher than Wells Fargo’s 27% and Bank of America’ 31%. When interest rates rise and bond prices fall, it naturally puts greater pressure on its balance sheet. Second, its cash ratio is only 7%, which is lower than Wells Fargo’s 12% and Bank of America’ 11%. When customers withdraw their deposits, Wells Fargo and Bank of America can rely on their available cash to meet the need, but SVB’s cash on hand is not sufficient to cover the withdrawals, so it is forced to sell its bonds, resulting in losses.
While the management of the SVB is culpable, the nature of SVB’s customers and the Federal Reserve’s shifting monetary policy also contributed to its collapse. It can be predicted that if the US continues to raise interest rates, causing M2 to continue to decline, more banks with higher proportions of bond investments and relatively tight liquidity will encounter problems.
Overall, US banks seem to be facing liquidity issues rather than asset quality issues as in 2008.
Some may ask, under the current global liquidity environment, will banks in Hong Kong face similar issues? We may start with looking into virtual banks, as they have been the fastest-growing segment in terms of deposits in Hong Kong in recent years. Additionally, with relatively short customer credit histories, banks are also unwilling to make a large amount of loans, which may result in the possibility of banks allocating a bigger portion of customers’ deposits in bonds.
The annual reports of the three major virtual banks in Hong Kong show that –
Virtual Bank A: as the end of 2021, approximately half of its assets are invested in bonds issued by other banks and companies, all of which are classified as fair value through other comprehensive income (FVOCI), so they are marked to market and gains or losses are reflected in comprehensive income. The Common Equity Tier 1 (CET1) ratio of “Virtual Bank A” was 28.5% in March last year, which exceeded regulatory requirements. However, the risk lies in the fact that half of its assets are invested in bond investments, and if interest rates continue to rise, there may be a potential impact on its CET1 ratio in the future, so caution should still be exercised.
Virtual Bank B: about 13% of its assets was invested in government and other bank bonds, which is a relatively low proportion, and its CET1 ratio reached 54% in March last year, indicating low risk.
Virtual Bank C: at the end of 2021, approximately two-thirds of its assets was deposited in the central bank or other banks, and one-third was invested in bonds. In March last year, its CET1 ratio was about 200%, indicating minimal risk of insolvency.
Disclaimer
This document is based on management forecasts and reflects prevailing conditions and our views as of this date, all of which are accordingly subject to change. In preparing this document, we have relied upon and assumed without independent verification, the accuracy and completeness of all information available from public sources. All opinions or estimates contained in this document are entirely Zeal Asset Management Limited’s judgment as of the date of this document and are subject to change without notice.
Investments involve risks. Past performance is not indicative of future performance. You may lose part or all of your investment. You should not make an investment decision solely based on this information. Each Fund may have different underlying investments and be exposed to a number of different risk, prior to investing, please read the offering documents of the respective funds for details, including risk factors. If you have any queries, please contact your financial advisor and seek professional advice. This material is issued by Zeal Asset Management Limited and has not been reviewed by the Securities and Futures Commission in Hong Kong.
There can be no assurance that any estimates of future performance of any industry, security or security class discussed in this presentation can be achieved. The portfolio may or may not have current investments in the industry, security or security class discussed. Any reference or inference to a specific industry or company listed herein does not constitute a recommendation to buy, sell, or hold securities of such industry or company. Please be advised that any estimates of future performance of any industry, security or security class discussed are subject to change at any time and are current as of the date of this presentation only. Targets are objectives only and should not be construed as providing any assurance or guarantee as to the results that may be realized in the future from investments in any industry, asset or asset class described herein.